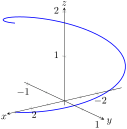
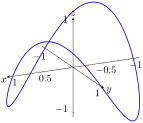
Graph of the function
\(\vec r(t) = \la \cos(t) , \sin(t) ,\sin(2t)\ra\) on
\([0,2\pi]\text{.}\) The graph of the function resembles a saddle centered at the origin whose height is defined by the
\(z\)-axis. The two sides of the saddle that taper off fall into negative
\(z\) and lie in the second and third quadrants in the
\(xy\) plane. Ignoring the
\(z\) coordinate, the curve is a unit circle in the
\(xy\) plane. Ignoring the
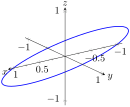
\(x\) or
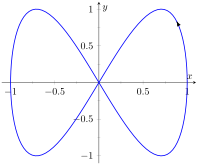
\(y\) coordinates individually, the curve looks like the
\(\infty\) symbol in the
\(yz\) and the
\(xz\) planes, respectively. We now describe the
\(z\) coordinate with respect to travelling along the unit circle in the
\(xy\) plane. Starting at
\(t=\text{,}\) the function begins at the point
\((1,0,0)\text{.}\) As
\(t\) increases and we travel along the unit circle in the
\(x\) and
\(y\) coordinates,
\(z\) increases until we get to
\(t=\frac{\pi}{2}\) at which
\(z=1\text{.}\) Then, continuing along the unit circle,
\(z\) decreases until it reaches a minimum of
\(z=-1\) when
\(t=\frac{3\pi}{4}\text{.}\) Continuing along the circle,
\(z\) begins to increase once again, reaching one more maximum of
\(z=1\) when
\(t=\frac{5\pi}{4}\text{.}\) Finally,
\(z\) begins to decrease, reaching its last minimum of
\(z=1\) when
\(t=\frac{7\pi}{4}\text{,}\) after which
\(z\) increases, and the curve ends where it began, at the point
\((1,0,0)\text{.}\)